
If you've ever stared at a project that felt impossible to track — tasks scattered across sticky notes, deadlines slipping because nobody knows who is doing what — a Gantt chart might be exactly what you need.
The short answer
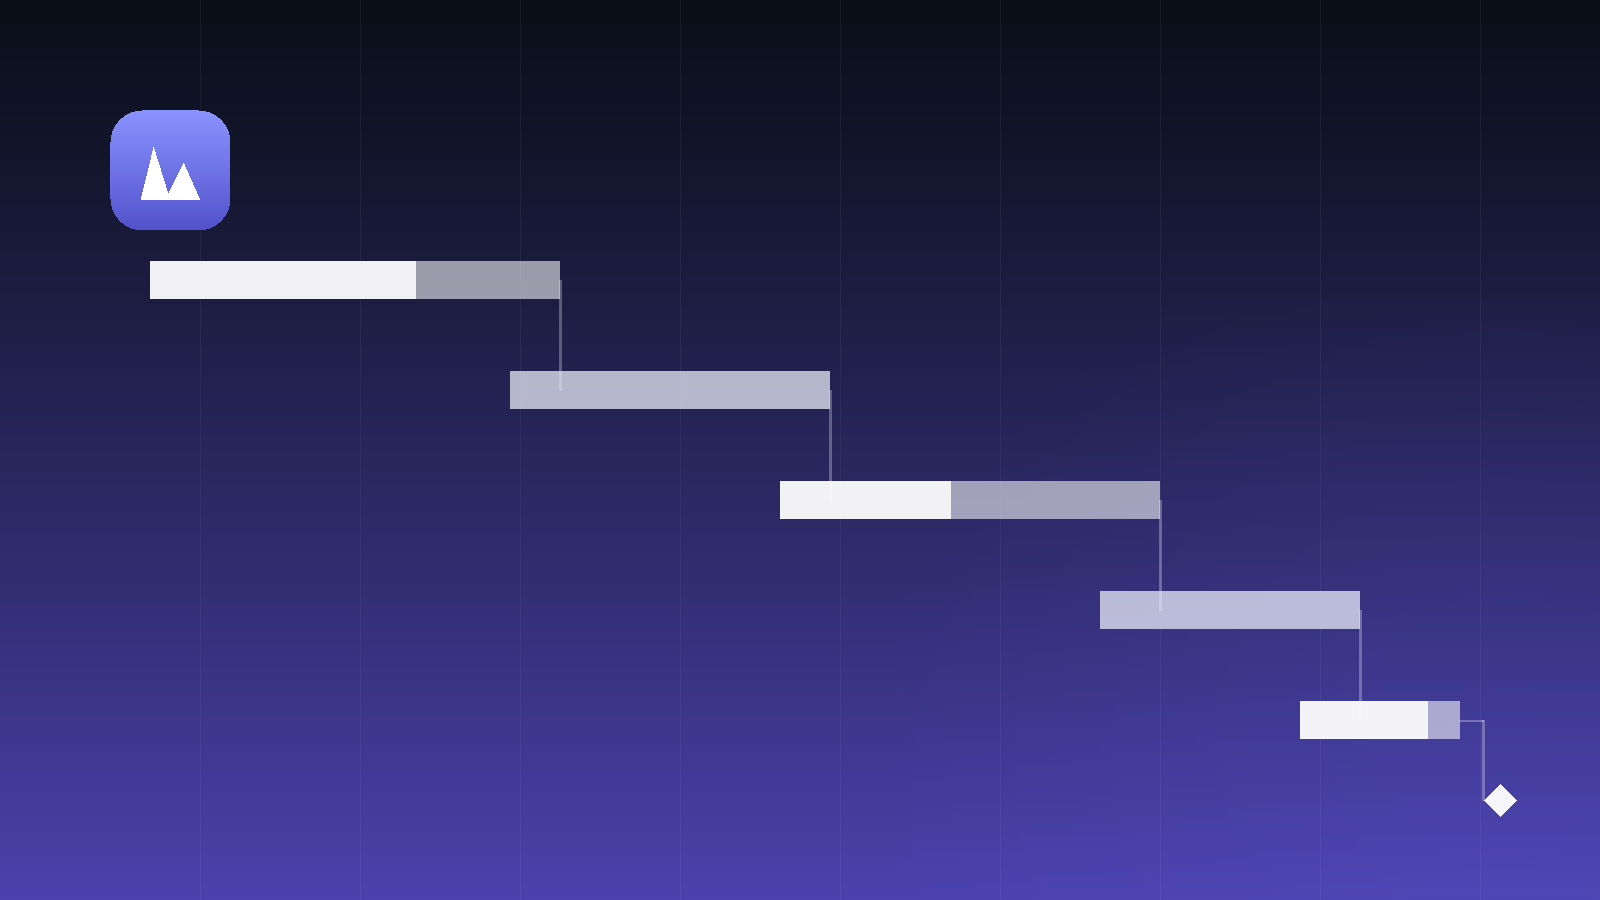
A Gantt chart is a bar chart that shows a project's tasks on a timeline. Each task gets its own row. Each row shows when the task starts, how long it takes, and when it ends. The result is a visual map of your whole project: what happens when, and how everything fits together.
The concept has been around for over a century (credited to engineer Henry Gantt, circa 1910), but modern project management tools have made it practical for teams of every size — not just construction crews or defence contractors.
What a Gantt chart actually shows
A well-built Gantt chart answers three questions at once:
What needs to happen? Every task in the project gets a row. You can group tasks into phases or milestones — for example, a product launch might have phases for Research, Design, Development, and Review.
When does each task happen? Each row has a bar that spans the dates the task is active. At a glance you can see which tasks run in parallel, which are sequential, and where the project is dense versus quiet.
Who is responsible? Gantt charts show assignees alongside each task. When a team member looks at the chart, they can immediately see their own work in context — not in isolation, but as part of the bigger picture.
Dependencies: the hidden power of Gantt charts
The real power of a Gantt chart kicks in when you add dependencies — links between tasks that say "this task can't start until that one finishes."
For example: you can't start user testing until the prototype is built. You can't write the user manual until the feature is finalised. Linking these tasks means that if the prototype slips by three days, the chart shows you the ripple effect downstream before it surprises you.
Without dependencies, a schedule is just a list of dates. With them, it becomes a model of how your project actually works.
Gantt charts vs. Kanban boards: which one do you need?
Both are popular in modern project management, and they answer different questions.
A Kanban board (columns like To Do → In Progress → Done) is great for ongoing work where tasks flow continuously — a support queue, a content pipeline, a product backlog. It shows you status.
A Gantt chart is better for time-bound projects with a defined start and end: a product launch, a website redesign, a quarterly campaign. It shows you schedule.
Many teams use both. In MiniGantt, you can switch between the Kanban view and the Gantt timeline on the same project without losing any data, so you don't have to choose.
A practical example: planning a website redesign
Say your team is redesigning a company website in eight weeks. Here is how you might structure the Gantt chart:
- Weeks 1–2 — Discovery: stakeholder interviews, content audit
- Weeks 2–4 — Design: wireframes, then visual design
- Weeks 4–6 — Development: front-end build and CMS integration (can overlap with late design)
- Week 7 — QA: testing and fixes
- Week 8 — Launch: go-live and review
At a glance you can see that Development can start before Design finishes, and that QA needs Development to wrap up first. You've turned a vague "eight-week project" into a concrete, trackable plan — one where every team member knows exactly where they stand.
Common mistakes teams make with Gantt charts
Making it too detailed too early. You don't need every sub-task in the chart on day one. Start with phases and major milestones, then add detail as the project progresses.
Forgetting to update it. A Gantt chart is only useful if it reflects reality. Build a habit of updating task status at least once a week. In MiniGantt you can drag task bars directly on the timeline to adjust dates as things shift.
Ignoring buffer time. Real projects have unexpected delays. Build short buffers between dependent phases, especially before hard deadlines like a client presentation or a product launch.
Getting started in MiniGantt
If you want to try a Gantt chart for your next project, MiniGantt keeps it straightforward:
- Create a project and add your tasks on the Kanban board.
- Set start and due dates for each task.
- Switch to the Gantt tab — your tasks appear as bars on a timeline automatically.
- Drag bars to adjust dates, or extend a bar to change duration.
- Assign team members so everyone can see their work in context.
The Gantt view is included on the Free plan, so you can try it today without entering a payment method.
The bottom line
A Gantt chart is a time-tested tool because it solves a real problem: making a complex project visible at a glance. It won't manage your project for you, but it will make sure nothing important disappears into a spreadsheet nobody checks.
If your team is juggling multiple deadlines and wondering why things always seem to slip, adding a Gantt chart to your workflow is one of the most practical first steps you can take.